Euclid Observability
Overview
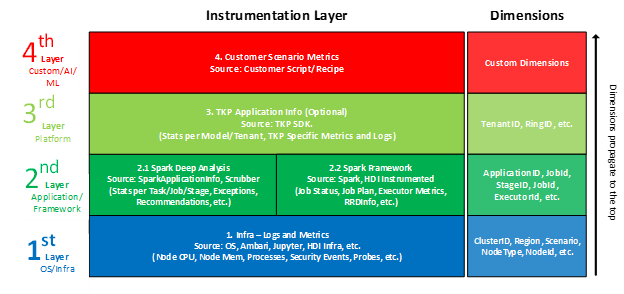
Euclid Observability is the EWS officially recommended way to instrument and analyze metrics and logs generated by EWS pipeline. There are out-of-box dashabords and metrics for each provisioned EWS workspace. Previously to troubleshoot issues with HDI, data engineer needs to JIT elevate and search the raw logs in Yarn portal. With the help of Euclid Observability, job-level, node-level and cluster-level HDI related metrics and logs are instrumented into Geneva for visualization and analysis. Data engineers are also allowed to instrument customized metrics and logs using the Telemetry SDK, and then setup monitors and alerts based on the instrumentation.

Here're the problems that Observability aims to solve:
- Compliant troubleshooting without elevation to sensitive resources
- Lost logs from scaled down HDI nodes
- QoS standardization across partners allow platform monitoring
- Standardized guidance for privacy events scrubbing
- Self-serve capabilities for Dashboarding, Logging, Incident Creation, etc
- Self-serve movement of logs to systems such as Kusto for richer analysis
- Centralized place for Platform Teams to observe partners’ health
- Integration with monitoring and alerting services already used like IcM
Resources
- Euclid OIVIC dashboard
- Ticket template to enable custom metrics and logs
- HDI Observability MSAI bootcamp talk
- Euclid Observability: HDI Monitoring
- Euclid Observability: Vision and Design
- TelemetrySDK Workshop
- TelemetrySDK Scala usage documentation
- TelemetrySDK PySpark documentation
- Scala example
- Python example